
India Cardiac Surgery Site is associated with experienced cardiologists to deliver the perfect treatment and recuperative plan. Before the surgery, we will educate the patient with every fact involved in surgery and maintain the transparency in procedure, facilities and the related costs. We provide quality services and also assists with arrangements by keeping the concerns of the international patients in mind, providing you the utmost care and professionalism.
How to Get Started?

Planning your medical trip to India is a very simple process with India Cardiac Surgery Site
1. Fill in our enquiry form and one of our executives will contact you soon.
2. Call us at +91-9370586696 for any assistance.
3. Complete information regarding surgery is available on our website.
Electrocardiogram
An electrocardiogram (ECG or EKG, abbreviated from the GermanElektrokardiogramm) is a graphic produced by an electrocardiograph, which records the electrical activity of the heart over time. Its name is made of different parts: electro, because it is related to electrical activity, cardio, Greek for heart,gram, a Greek root meaning “to write”. In the US, the abbreviation “EKG” is often preferred over “ECG”, while “ECG” is used universally in the UK and many other countries.
Electrical impulses in the heart originate in the sinoatrial node and travel through the heart muscle where they cause contraction. The electrical waves can be measured at selectively placed electrodes (electrical contacts) on the skin. Electrodes on different sides of the heart measure the activity of different parts of the heart muscle. An ECG displays the voltage between pairs of these electrodes, and the muscle activity that they measure, from different directions, also understood as vectors. This display indicates the overall rhythm of the heart, and weaknesses in different parts of the heart muscle. It is the best way to measure and diagnose abnormal rhythms of the heart, particularly abnormal rhythms caused by damage to the conductive tissue that carries electrical signals, or abnormal rhythms caused by levels of dissolved salts (electrolytes), such as potassium, that are too high or low. In myocardial infarction (MI), the ECG can identify damaged heart muscle. But it can only identify damage to muscle in certain areas, so it can’t rule out damage in other areas. The ECG cannot reliably measure the pumping ability of the heart; for which ultrasound-based (echocardiography) or nuclear medicine tests are used.
History
Alexander Muirhead attached wires to a feverish patient’s wrist to obtain a record of the patient’s heartbeat while studying for his Doctor of Science (in electricity) in 1872 at St Bartholomew’s Hospital. This activity was directly recorded and visualized using a Lippmann capillary electrometer by the British physiologist John Burdon Sanderson. The first to systematically approach the heart from an electrical point-of-view was Augustus Waller, working in St Mary’s Hospital in Paddington, London. His electrocardiograph machine consisted of a Lippmann capillary electrometer fixed to a projector. The trace from the heartbeat was projected onto a photographic plate which was itself fixed to a toy train. This allowed a heartbeat to be recorded in real time. In 1911 he still saw little clinical application for his work.
The breakthrough came when Willem Einthoven, working in Leiden, The Netherlands, used the string galvanometer which he invented in 1901, which was much more sensitive than the capillary electrometer that Waller used.
Einthoven assigned the letters P, Q, R, S and T to the various deflections, and described the electrocardiographic features of a number of cardiovascular disorders. In 1924, he was awarded the Nobel Prize in Medicine for his discovery.
Though the basic principles of that era are still in use today, there have been many advances in electrocardiography over the years. The instrumentation, for example, has evolved from a cumbersome laboratory apparatus to compact electronic systems that often include computerized interpretation of the electrocardiogram.
Check out the Patient Testimonial, where the patient shares about their success stories from treatments through India Cardiac Surgery Consultants.
ECG Graph Paper
A typical electrocardiograph runs at a paper speed of 25 mm/s, although faster paper speeds are occasionally used. Each small block of ECG paper is 1 mm². At a paper speed of 25 mm/s, one small block of ECG paper translates into 0.04 s (or 40 ms). Five small blocks make up 1 large block, which translates into 0.20 s (or 200 ms). Hence, there are 5 large blocks per second. A diagnostic quality 12 lead ECG is calibrated at 10 mm/mV, so 1 mm translates into 0.1 mV. A calibration signal should be included with every record. A standard signal of 1 mV must move the stylus vertically 1 cm, that is two large squares on ECG paper.
Filter Selection
Modern ECG monitors offer multiple filters for signal processing. The most common settings are monitor mode and diagnostic mode. In monitor mode, the low frequency filter (also called the high-pass filter because signals above the threshold are allowed to pass) is set at either 0.5 Hz or 1 Hz and the high frequency filter (also called the low-pass filter because signals below the threshold are allowed to pass) is set at 40 Hz. This limits artifact for routine cardiac rhythm monitoring. The high-pass filter helps reduce wandering baseline and the low pass filter helps reduce 50 or 60 Hz power line noise (the power line network frequency differs between 50 and 60 Hz in different countries). In diagnostic mode, the high pass filter is set at 0.05 Hz, which allows accurate ST segments to be recorded. The low pass filter is set to 40, 100, or 150 Hz. Consequently, the monitor mode ECG display is more filtered than diagnostic mode, because its bandpass is narrower
Leads
Graphic showing the relationship between positive electrodes, depolarization wavefronts (or mean electrical vectors), and complexes displayed on the ECG.
The word lead has two meanings in electrocardiography: it refers to either the wire that connects an electrode to the electrocardiograph, or (more commonly) to a combination of electrodes that form an imaginary line in the body along which the electrical signals are measured. Thus, the term loose lead artifact uses the former meaning, while the term 12 lead ECG uses the latter. In fact, a 12 lead electrocardiograph usually only uses 10 wires/electrodes. The latter definition of lead is the one used here.
An electrocardiogram is obtained by measuring electrical potential between various points of the body using a biomedical instrumentation amplifier. A lead records the electrical signals of the heart from a particular combination of recording electrodes which are placed at specific points on the patient’s body.
- When a depolarization wavefront (or mean electrical vector) moves toward a positive electrode, it creates a positive deflection on the ECG in the corresponding lead.
- When a depolarization wavefront (or mean electrical vector) moves away from a positive electrode, it creates a negative deflection on the ECG in the corresponding lead.
- When a depolarization wavefront (or mean electrical vector) moves perpendicular to a positive electrode, it creates an equiphasic (or isoelectric) complex on the ECG. It will be positive as the depolarization wavefront (or mean electrical vector) approaches (A), and then become negative as it passes by (B).
There are two types of leads—unipolar and bipolar. The former have an indifferent electrode at the center of the Einthoven’s triangle (which can be likened to the ‘neutral’ of a wall socket) at zero potential. The direction of these leads is from the “center” of the heart radially outward. These include the precordial (chest) leads and augmented limb leads—VR, VL, & VF. The bipolar type, in contrast, has both electrodes at some potential, with the direction of the corresponding lead being from the electrode at lower potential to the one at higher potential, e.g., in limb lead I, the direction is from left to right. These include the limb leads—I, II, and III.
Note that the colouring scheme for leads varies by country.
Limb
Leads I, II and III are the so-called limb leads because at one time, the subjects of electrocardiography had to literally place their arms and legs in buckets of salt water in order to obtain signals for Einthoven’s string galvanometer. They form the basis of what is known as Einthoven’s triangle. Eventually, electrodes were invented that could be placed directly on the patient’s skin. Even though the buckets of salt water are no longer necessary, the electrodes are still placed on the patient’s arms and legs to approximate the signals obtained with the buckets of salt water. They remain the first three leads of the modern 12 lead ECG.
- Lead I is a dipole with the negative (white) electrode on the right arm and the positive (black) electrode on the left arm.
- Lead II is a dipole with the negative (white) electrode on the right arm and the positive (red) electrode on the left leg.
- Lead III is a dipole with the negative (black) electrode on the left arm and the positive (red) electrode on the left leg.
Augmented Limb
Proper placement of the limb leads.
Leads aVR, aVL, and aVF are augmented limb leads. They are derived from the same three electrodes as leads I, II, and III. However, they view the heart from different angles (or vectors) because the negative electrode for these leads is a modification of Wilson’s central terminal, which is derived by adding leads I, II, and III together and plugging them into the negative terminal of the EKG machine. This zeroes out the negative electrode and allows the positive electrode to become the “exploring electrode” or a unipolar lead. This is possible because Einthoven’s Law states that I + (-II) + III = 0. The equation can also be written I + III = II. It is written this way (instead of I + II + III = 0) because Einthoven reversed the polarity of lead II in Einthoven’s triangle, possibly because he liked to view upright QRS complexes. Wilson’s central terminal paved the way for the development of the augmented limb leads aVR, aVL, aVF and the precordial leads V1, V2, V3, V4, V5, and V6.
- Lead aVR or “augmented vector right” has the positive electrode (white) on the right arm. The negative electrode is a combination of the left arm (black) electrode and the left leg (red) electrode, which “augments” the signal strength of the positive electrode on the right arm.
- Lead aVL or “augmented vector left” has the positive (black) electrode on the left arm. The negative electrode is a combination of the right arm (white) electrode and the left leg (red) electrode, which “augments” the signal strength of the positive electrode on the left arm.
- Lead aVF or “augmented vector foot” has the positive (red) electrode on the left leg. The negative electrode is a combination of the right arm (white) electrode and the left arm (black) electrode, which “augments” the signal of the positive electrode on the left leg.
The augmented limb leads aVR, aVL, and aVF are amplified in this way because the signal is too small to be useful when the negative electrode is Wilson’s central terminal. Together with leads I, II, and III, augmented limb leads aVR, aVL, and aVF form the basis of the hexaxial reference system, which is used to calculate the heart’s electrical axis in the frontal plane.
Precordial
Leads V1, V2, and V3 are referred to as the right precordial leads and V4, V5, and V6 are referred to as the left precordial leads.
The QRT complex should be negative in lead V1 and positive in lead V6. The QRT complex should show a gradual transition from negative to positive between leads V2 and V4. The equiphasic lead is referred to as the transition lead. When the transition occurs earlier than lead V3, it is referred to as an early transition. When it occurs later than lead V3, it is referred to as a late transition. There should also be a gradual increase in the amplitude of the R wave between leads V1 and V4. This is known as R wave progression. Poor R wave progression is a nonspecific finding. It can be caused by conduction abnormalities, myocardial infarction, cardiomyopathy, and other pathological conditions.
- Lead V1 is placed in the fourth intercostal space to the right of the sternum.
- Lead V2 is placed in the fourth intercostal space to the left of the sternum.
- Lead V3 is placed directly between leads V2 and V4.
- Lead V4 is placed in the fifth intercostal space in the midclavicular line (even if the apex beat is displaced).
- Lead V5 is placed horizontally with V4 in the anterior axillary line
- Lead V6 is placed horizontally with V4 and V5 in the midaxillary line.
Ground
An additional electrode (usually green) is present in modern four-lead and twelve-lead ECGs. This is the ground lead and is placed on the right leg by convention, although in theory it can be placed anywhere on the body. With a three-lead ECG, when one dipole is viewed, the remaining lead becomes the ground lead by default
Waves and Intervals
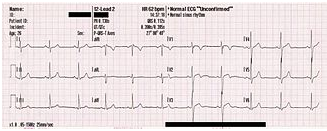
A typical ECG tracing of a normal heartbeat (or cardiac cycle) consists of a P wave, a QRS complex and a T wave. A small U wave is normally visible in 50 to 75% of ECGs. The baseline voltage of the electrocardiogram is known as theisoelectric line. Typically the isoelectric line is measured as the portion of the tracing following the T wave and preceding the next P wave.
Rhythm analysis
There are some basic rules that can be followed to identify a patient’s heart rhythm. What is the rate? Is it regular or irregular? Are P waves present? Are QRS complexes present? Is there a 1:1 ratio between P waves and QRS complexes? Is the PR interval constant?
FAQ’s
- What is an EKG?
- An EKG is a noninvasive test that records the electrical activity (rhythm and rate) of your heart. This test is one of the simplest and quickest ways to determine how well your heart works.
- What happens during the test?
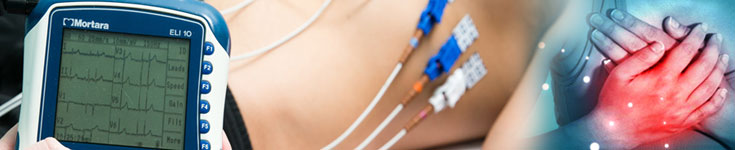
- During this painless test, small plastic electrodes are placed on your chest, arms and legs. The electrodes are then connected to an EKG machine that monitors your heart’s activity. A blood pressure cuff will be applied to your arm and will check your blood pressure regularly. A traditional EKG will be conducted while you’re lying down, and should take no more than 10 minutes .If you have certain conditions, your doctor may order an exercise EKG. Exercise EKGs, also known as stress tests, are similar to traditional EKGs except that you will be exercising on a treadmill or stationary bike instead of lying down when the test is conducted. This test helps physicians evaluate changes in your heart’s activity during stress.
- What if I have symptoms during the test?
- It’s vital that you report any symptoms such as chest pain or discomfort, dizziness or shortness of breath to the technician. Our skilled professionals are prepared to handle any symptoms you may have during testing.
- What happens after the test?
- After your exam, you can return to your daily routine. A cardiologist the hospital will interpret your test results and send them to your referring physician. To discuss your results, please talk to your primary care or referring physician.
- What else you should know about an EKG?
- Your primary care physician or cardiologist may order an EKG for a number of different reasons. Here are some examples of why you may need an EKG:
- If you have irregular heartbeats or rhythms
- If there is a decreased supply of blood and oxygen to your heart
- To check how an implanted pacemaker is working
- To check how your heart medications are working
- To determine which part of your heart is damaged
- To diagnose the cause of chest pain
- To see if you’ve had a heart attack
- So you’ll feel more at ease during your test
- Why should a patient choose India Cardiac Surgery Consultants for cardiac care?
- India, Cardiac Surgery Consultants provide a vast number of high quality cardiac services. The cardiac team includes board-certified cardiologists and cardiac surgeons, specially trained nurses, and registered technologists. The cardiac team at uses the most advanced technologies available to perform the cardiac procedures at an affordable price and has a lower complication rate.
If you are really seeking Electrocardiogram in India, kindly fill up the form for a free consultation with our expert cardiologists. You will be provided with thorough analysis and suggestions regarding the Electrocardiogram you are seeking for.